Build a time tracking app with Google Apps Script and Plotly
Have you ever had an idea for an app but you just can’t find the right combination of features in what’s available on the web? Have you ever wanted to prototype something but weren’t sure where to start? What if I told you that you could extend Google Sheets to build your own custom tools?
In this gentle introduction to Google Apps Script, I will show you how to supercharge a Google Sheet with automations and custom data visualizations.
Apps Script is like Excel’s VBA, but way better. Why? Because you write JavaScript instead of some arcane language that you need to learn for a single application. After this tutorial, you’ll be ready to start using Apps Script to automate your workflows, create custom tools, and even build and deploy web apps.
what you’ll learn
This tutorial will introduce you to the Apps Script platform. You’ll also get experience with JavaScript, HTML and some basic web development concepts, including working with third-party libraries (we’ll be using Plotly’s JavaScript library). You don’t need to know JavaScript or HTML for this tutorial, but I hope your newfound power inspires you to keep learning!
The tutorial is presented in three parts. You can follow along or jump in at any part using the completed templates I’ve linked below.
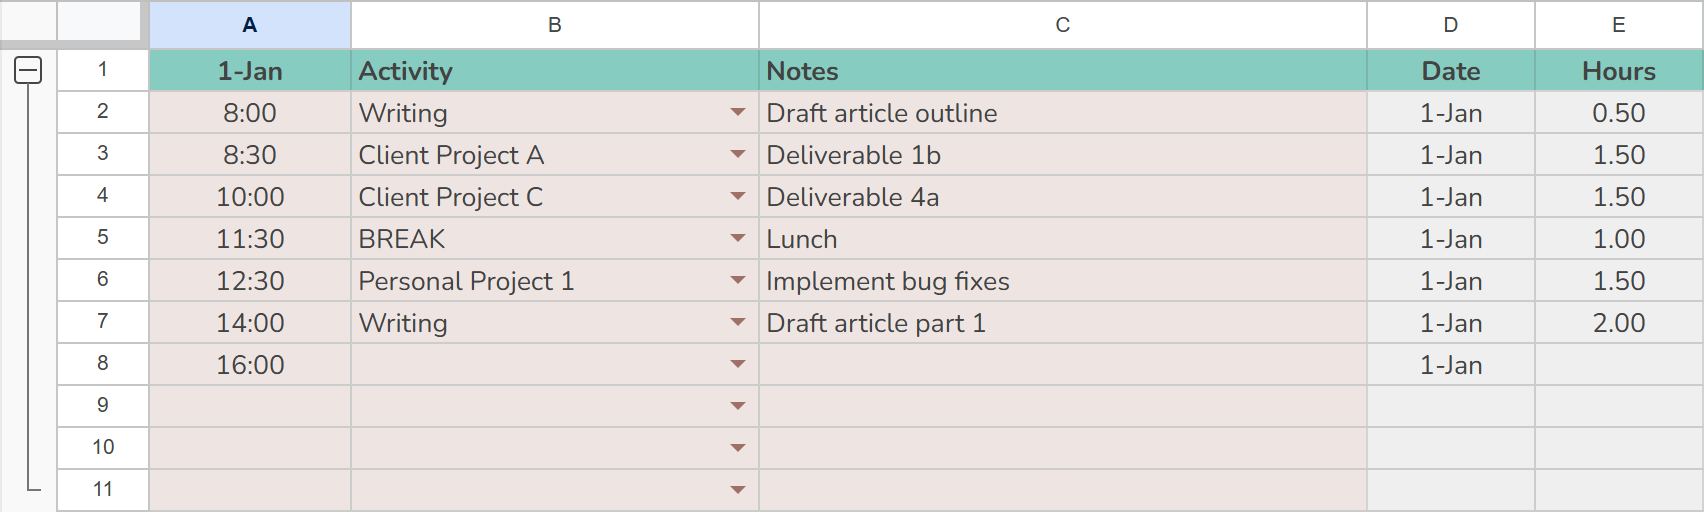
- Part 1: build the data entry form for a time tracking app using Google Sheets (completed template)
- Part 2: use Google Apps Script to automate key processes (completed template)
- Part 3: use the Plotly JavaScript library to create data visualizations (completed template)
the project
I’ve worked as a consultant for over ten years, which means I’ve become very accustomed to tracking and billing my time. I’ve tried every tool and technique out there. What I found works best for me is a simple Google Sheet where I can log the time anytime I switch tasks.
Follow along to build and deploy your own version. We’ll create the data entry form, add automation for data logging, and finally build an interactive data visualization. Then you’ll be ready to build your own tools using Apps Script.
![]()
You could of course opt to use Pivot Tables and Google Sheets’ built-in charts to analyze and visualize the data. However, using a third-party library like Plotly gives us more control and offers an opportunity to experiment.
project objectives
I want to understand two things using my time tracking app:
- How much time am I spending on each project?
- If I’m not working on a project during my work day, what am I doing instead?
Note that I don’t need to track every hour of my day to answer these questions. I only need to track (1) what I’m doing during the workday and (2) any time I spend working outside of my typical working hours.
I also want to make it as easy as possible to log a new task. I want to simply log the current time, the task name, and allow space to capture a few notes for myself.
Now that we know where we’re going, let’s get started!
Next: Time Tracker - part 1